 GMAT
GMAT
Integrated Reasoning Sample Questions
Question Type 1: Multi-Source Reasoning
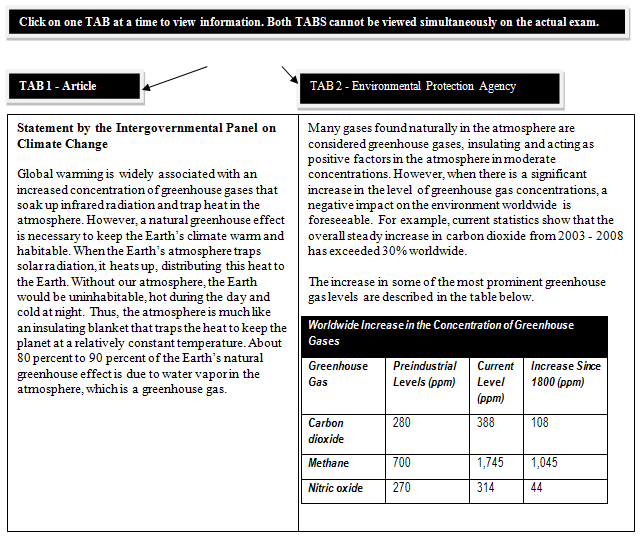
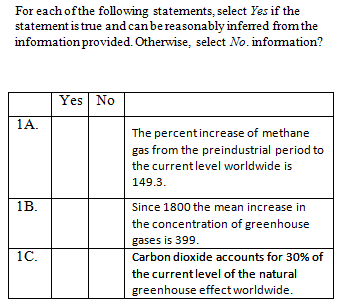
Question Setup: Multi-source reasoning questions test your ability to interpret two or three sources of information and respond by answering four questions. Sources appear labeled with tabs as (1) one passage, and either (2) a second passage or (3) a short passage with a table/graph/chart. Questions appear as three statement questions that ask you to click on the correct “yes” or “no” button to answer questions related to the sources, and one multiple-choice question that is related to the same sources of information.
Number of questions in each problem set: 3 yes/no questions plus 1 multiple-choice question.
Sample Question
For three questions, decide whether the three statements are true or false. For one question (not appearing), answer a standard multiple-choice question with five answer choices. Information may include communications in the form of articles from newspapers or journals, e-mails, notes, letters, presentations, charts, and other sources.
Question Type 2: Table Analysis
Question Type: Table with data and a passage — click on the correct “yes” or “no” answer to three statements (or math expressions)
Number of questions in each problem set: 3
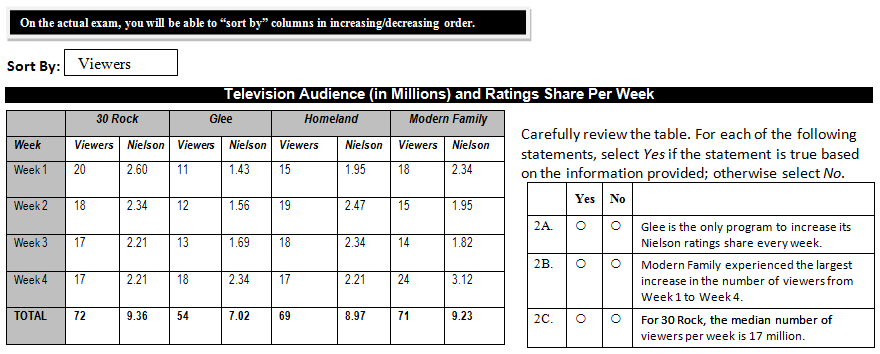
Each table contains specific headings for easy reference. Based on data from a table provided, questions will ask you to determine whether statements (or math expressions) are true or false (yes or no). On the actual exam, this type of question allows you to sort columns in increasing or decreasing order by clicking on a column’s heading (and viewing a drop-down list).
Read the passage and determine if each statement can, or cannot be determined based on your analysis of the table.
Sample Question
The depth of statistical research helps advertising sponsors refine advertising campaigns based on viewing audience composition. The table below lists Nielsen Ratings with a detailed analysis of viewers for four popular primetime television series. Statistical analysis includes demographics and viewer behaviors.
Question Type 3: Graphics Interpretation
Question Type: A graph (or diagram) with a short passage are followed by two fill-in-the blank statements.
Number of questions in each problem set: 2 (sometimes one statement with two blanks).
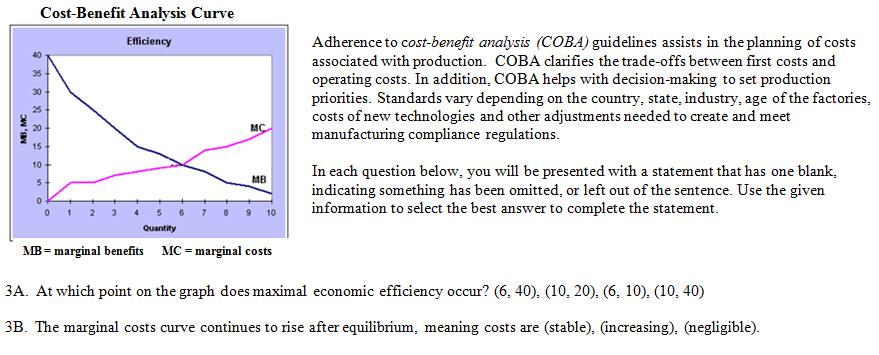
Graphics Interpretation questions appear with a bar, line, pie scatter plot graph, or flow/organizational chart. Questions in this format require that you interpret data from a graphic figure to complete a statement. Each statement contains one or two blanks with a “drop-down” menu to help you select the correct answer choice from among three to five choices.
Graphs fall into several categories:
- Bar graph―Shows comparisons among items in a data set.
- Line graph―Shows change in data over time.
- Pie chart―Shows comparisons of data as percentages of a whole.
- Scatter plot―Shows where individual data points fall in relation to a pair of variables.
- Flow/organizational chart―Shows a visual organization of steps in a process or the structure of relationships.
Sample Question
Question Type 4: Two-Part Analysis
Question Type: Short passage (scenario) and statement outlining the task, followed by a two-column table with five to seven choices.
Number of questions in each problem set: 2
Two-part analysis questions ask you to read a short passage (scenario) and select two choices (parts) that best complete the task. Two columns with five to seven choices are provided from which you are to select your answers (one answer per column). The two-column headings are different, yet connected in some way. For example, “cause/effect,” “increase/decrease,” true/false,” “strengthen/weaken,” “height/width,” etc.
Sample Question
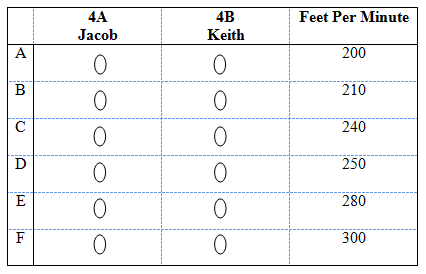
At 9:00, Jacob and Keith were exactly 11,100 feet apart and Jacob began walking towards Keith at a constant rate. At 9:20, Keith also began walking at a constant rate towards Jacob. They reached the same point at exactly 9:30.
Indicate in the table below the rate which each man walked. Make only one selection in each column by filling in the oval in the row that represents the correct answer. Note: on the actual exam, you will click on the two ovals that represent the correct answers.
ANSWER KEY
1A (yes), 1B (yes), 1C (no, answer 15.9%)
2A (yes), 2B (no), 2C (no, answer 17.5)
3A (6, 10), 3B (increasing)
4A (300 ft/minute), 4B (210 ft/minute)
